9 Ways Dashboard and Analytics Transform HR Data
In human resource management, making smart decisions depends on analysing large amounts of data. This article tells the story of how we can use the Dashboard and Analytics app to change complex HR data into visual intelligence. When technology and HR professionals come together, they help companies make better decisions about their employees and get the most out of them.
1. The Rise of HR Data Visualisation
A Paradigm Shift
Traditionally, HR data was hidden in spreadsheets and reports. This made it hard to get useful information from them. Now, we're witnessing a shift towards utilising HR data for practical decision-making. Dashboard and Analytics apps have changed things by turning raw data into visually engaging presentations we can easily understand. This change not only makes complex details easier to understand but also helps HR professionals make choices based on numbers quickly.
2. Crafting Dynamic Dashboards
Harmonising Key Metrics
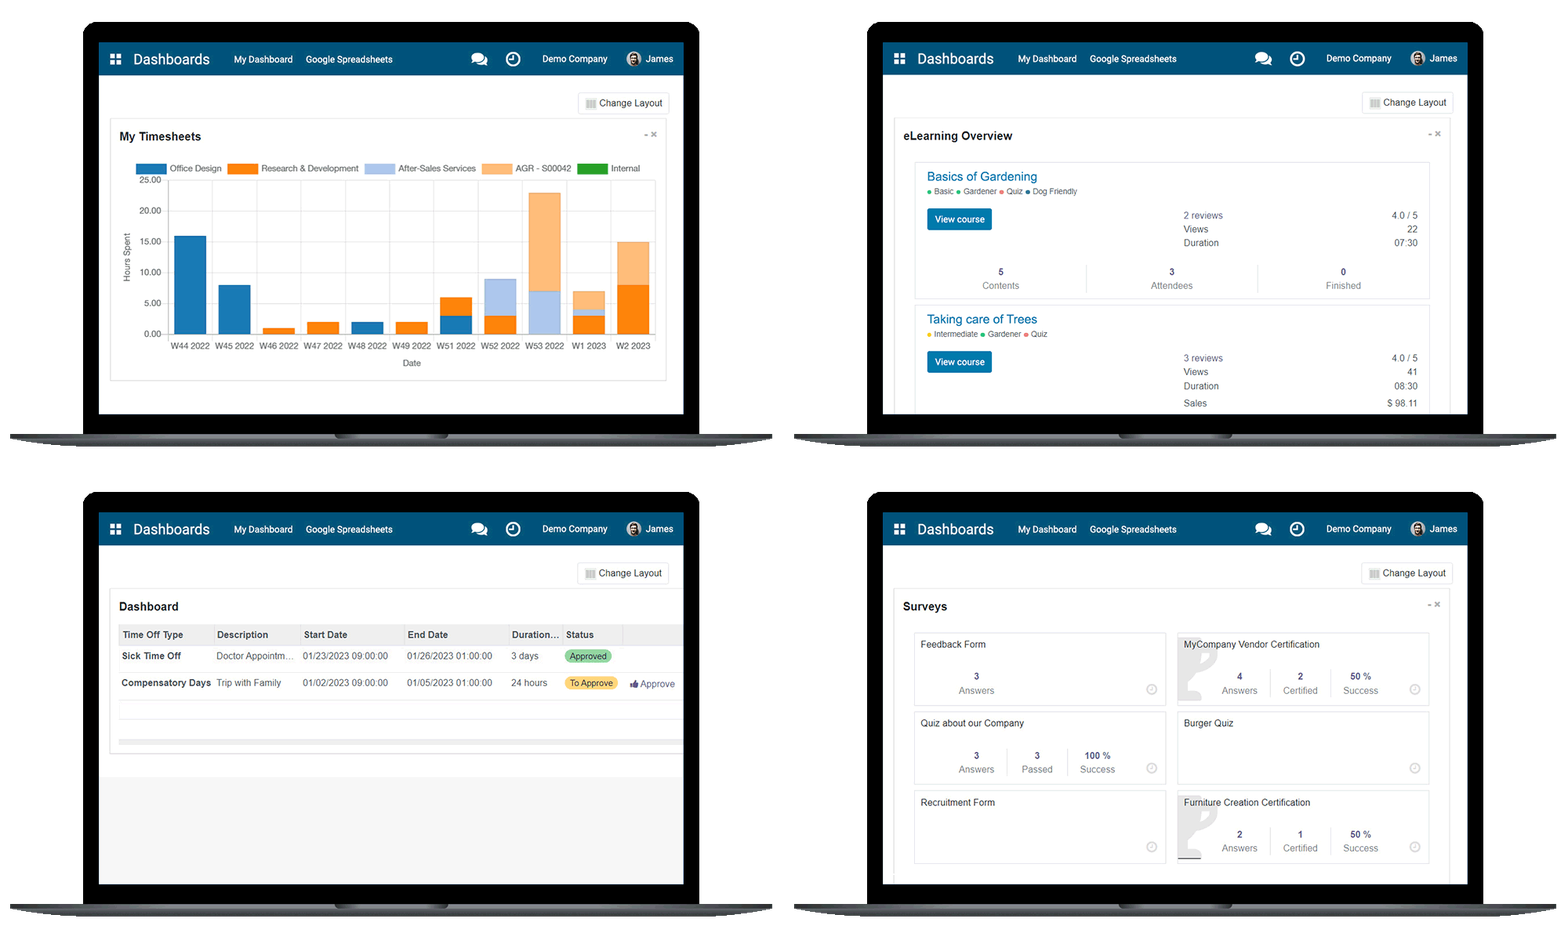
At the core of visualising data lies the art of crafting dynamic charts. These dashboards showcase crucial HR metrics effectively and timely. Dynamic dashboards facilitate monitoring employee performance, finding new staff, and understanding workforce diversity, providing a full picture to HR professionals. People who work in human resources can strategically arrange these visual compositions to guide big plans accurately.

3. Conveying Insights Effectively
Visual Storytelling
Visual intelligence is not only about showing data; it's about making a strong story. HR people can use the Dashboard and Analytics app to tell visual stories. With the help of smart charts, graphs, and interactive elements, HR leaders can share difficult ideas in a way that connects with diverse audiences. This shift from presenting data to storytelling fosters greater engagement, enhancing overall company-wide understanding and involvement.
4. User-Friendly Interactivity
Navigating HR Insights Seamlessly
One important part of the Dashboard and Analytics app is that it's easy for people to use. HR professionals can go through lots of data easily, learning more with just some button presses. This way of doing things not only makes it easier to look at data but also helps create an environment where people make decisions on their own. HR teams can handle problems and take chances with visual data. It helps them do things fast.
5. Predictive Analytics
Anticipating Workforce Trends
The Dashboard and Analytics apps are more than just historical data; they go into forecasting. People who work in human resources can now foresee where the workforce is going and make plans for future success. These apps help predict skill gaps, turnover rates, and emerging talents. They give HR managers a view into the future. This transformation shifts their role from reactive problem-solving to proactive facilitation of company success.
6. Enhancing Employee Engagement
Leveraging Visual Insights
Visual intelligence is very important for making employees more interested and involved. HR professionals can use apps to visualise how employees feel about their jobs, the sentiments they express, and how involved they are. This visual approach gives a complete look at how employees feel. It helps companies make plans to increase enthusiasm and create positive working conditions.
7. Diversity and Inclusion Metrics
Transparent Visibility
Dashboard and Analytics apps help to promote transparency in making things fair for everyone. By visually representing diversity metrics, HR leaders can see how things are getting better. They can find out where they should improve and talk clearly with key stakeholders. These visualisations help in fostering accountability and contributing to a more equitable workspace.
8. Strategic Communication
Visualising HR Insights for All
Effectively disseminating HR data holds immense significance. The Dashboard and Analytics app facilitate strategic communication initiatives that reach all levels of the organisation. When presenting visualisations to executives, managers, or employees, they break language barriers. It makes sure that HR data is understood by everyone. This helps create a cooperative and wise workplace for people of all languages.
9. Advancements in HR Data Visualisation
The Evolving Landscape
As technology continues to advance, the future of presenting HR data holds immense potential. The integration of artificial intelligence, augmented reality, and enhanced predictive analytics is coming soon. HR professionals embracing these innovations won't just stay ahead of the curve but will also drive the future of data utilisation in HR. They'll demonstrate how visual intelligence can become a must-have for businesses to succeed.
Wrapping Up
The fusion of the Dashboard and Analytics app marks a significant transformation for HR professionals. The valuable insights we get from these tools help HR leaders deal with difficulties, make informed decisions, and build strong teams.
As companies start using visual intelligence and forecasting capabilities, they set themselves up for a future where HR isn't merely a support function; instead, it becomes the main power behind making businesses successful. Smart use of visual intelligence is not a fleeting trend; it's a critical element for organisations aiming to excel in HR management and thrive in the competitive landscape.
Ready to experience the power of visual HR insights?
Explore Numla HR's Dashboard and Analytics App today!