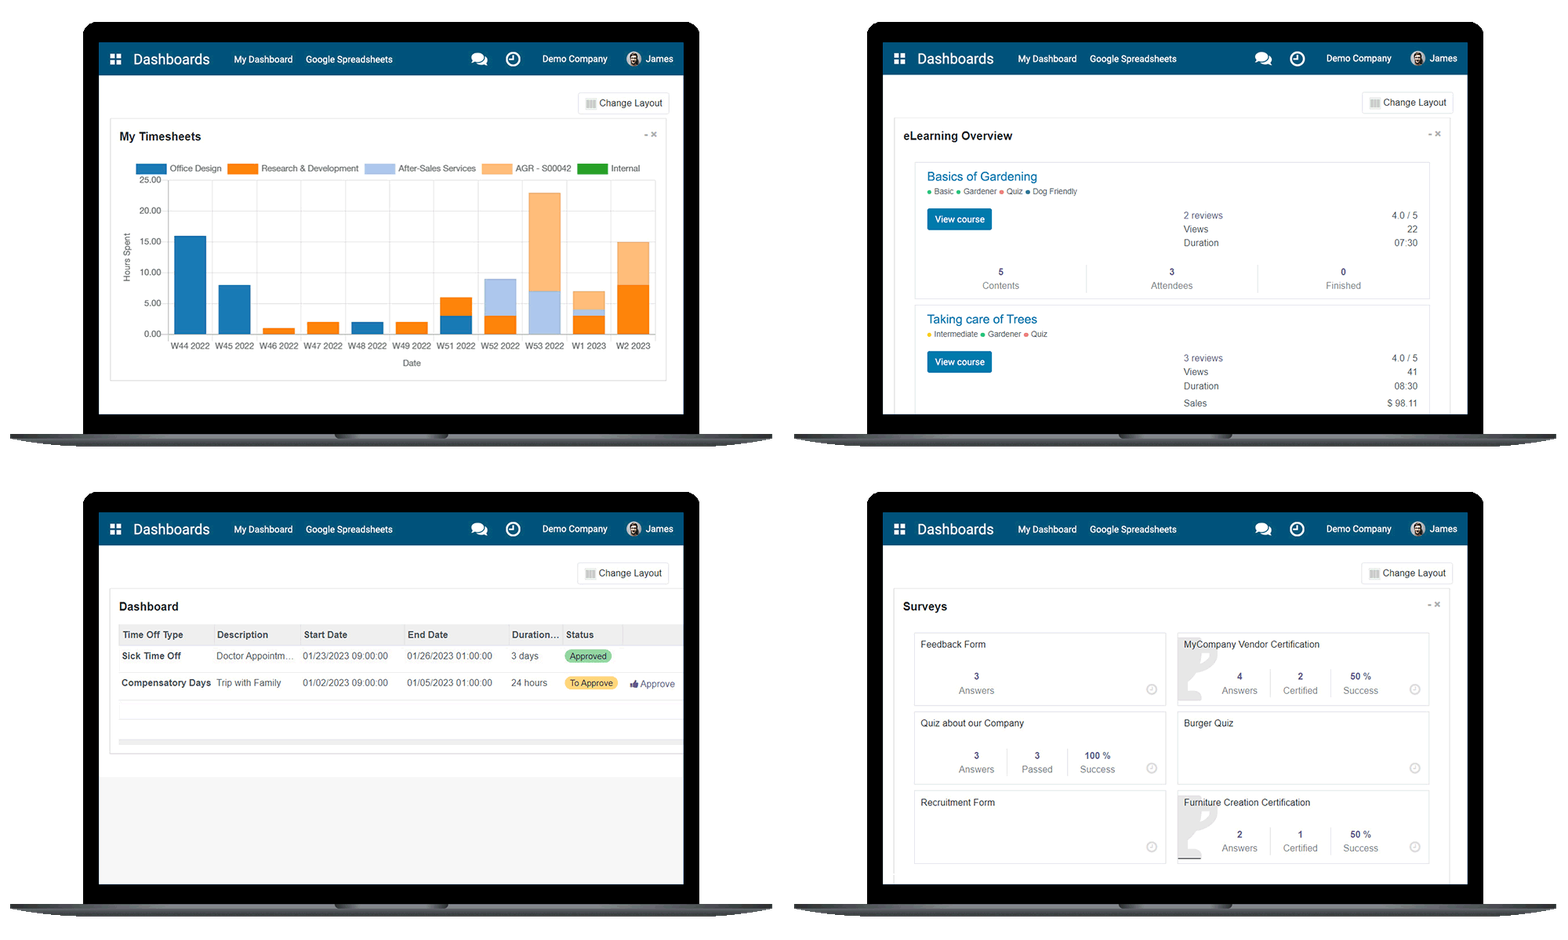
An Advanced Dashboard and Analytics Solution
Empower your HR strategy with real-time insights and data-driven decision-making using our advanced intuitive dashboard.

Represent HR data visually with a Dashboard and Analytics app
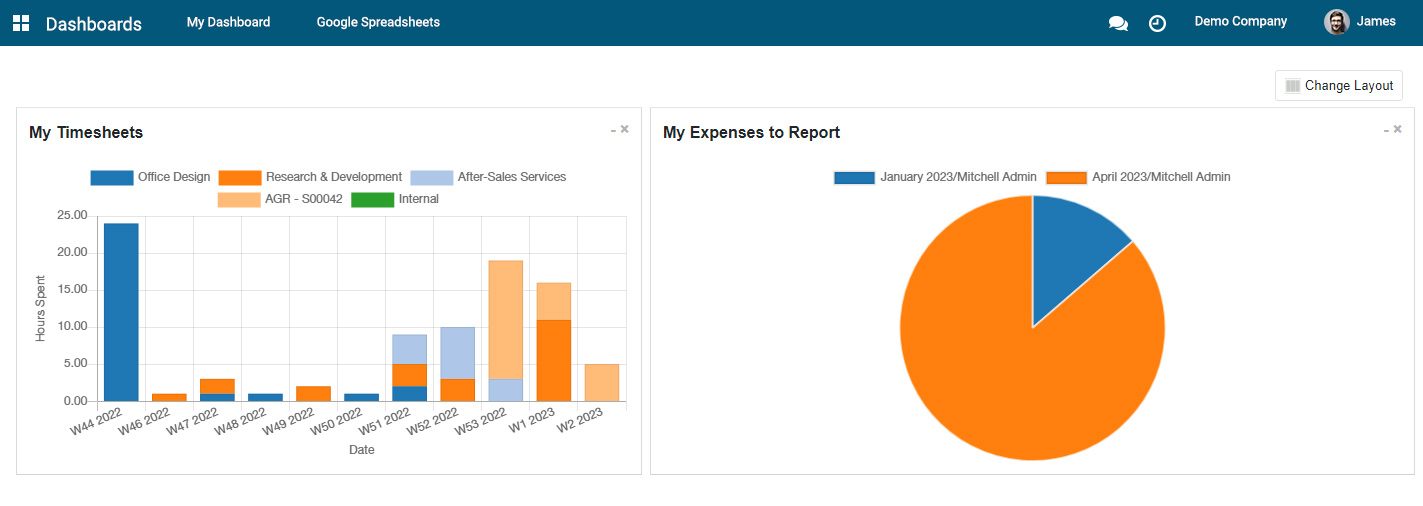
Create a visual representation of your HR data, in the form of charts, graphs, and other types of visualisations. Have a glimpse of the important information, like time-off, timesheets, and other HR data, on a single screen. You can also create custom views by selecting specific information from different HR apps, and organise it in a way that makes sense for you.

Add items to the dashboard
When you go into the Dashboards app, you see an empty dashboard. To customise your dashboard view, begin by going into any app such as Timesheets, select the 'Favorites' option, and then choose 'Add to Dashboard' from the available options. Now, the dashboard will display the respective view. Similarly, you can add multiple items to the dashboard.


Customise dashboard layout
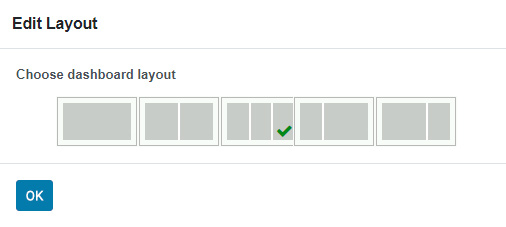
Personalise your dashboard experience with our 'Change layout' menu. Customise the layout to suit your preferences and optimise your data visualisation. You can even change the layout by simply dragging and dropping the menus.
Create Google Spreadsheets
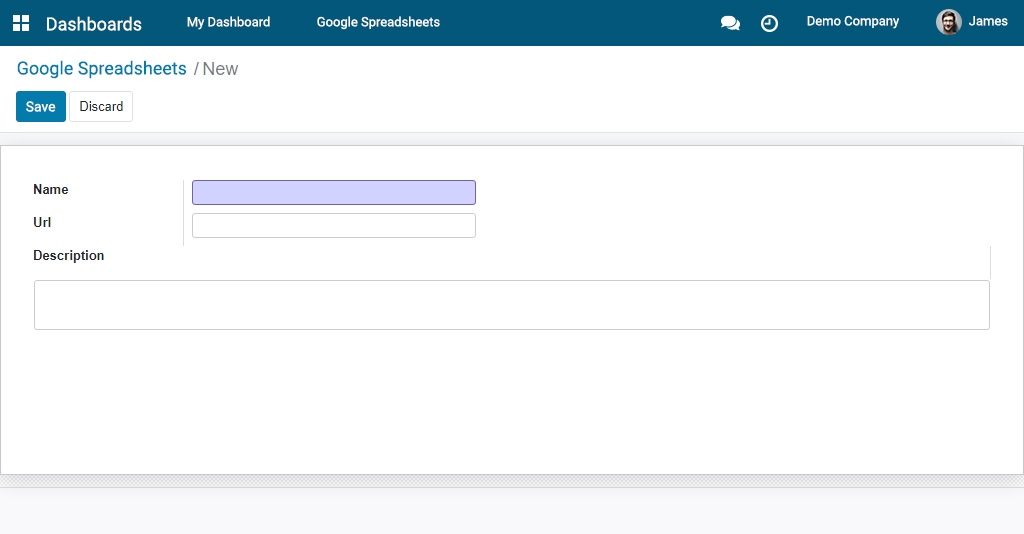
Easily integrate Google Spreadsheets into your dashboard view. Simply provide a name, URL, and description in the configuration window to quickly create a Google Spreadsheet and access your data.
