Using Odoo's Spreadsheet Module
Spreadsheets are one of the most widely used tools in the industry. In a spreadsheet, all the operational information of a business can be easily evaluated on a single page. It provides a necessary and clear graphical and data-oriented representation of business data efficiently.
In Odoo 16, there are numerous new features, including the ability to make projections, calculate commissions, analyse data, manipulate data, keep information up-to-date, highlight key details for easy comprehension, filter options, graph options, and support for the decision-making process.
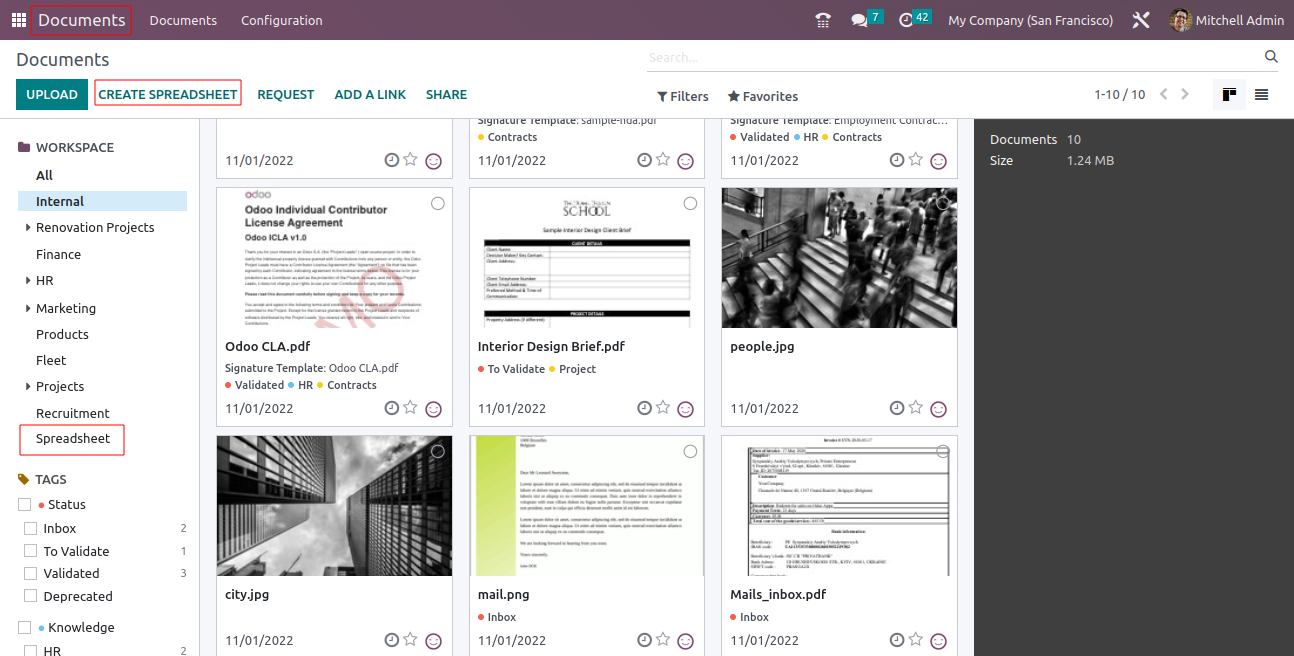
Odoo Spreadsheet can be utilised by any user in Odoo without any access rights restrictions. This feature is built on the 'Documents' module. Within the 'Documents' module, users will find both a button for creating a new spreadsheet and a centralised workspace for storing all spreadsheets.
When creating a new spreadsheet, you can choose between an empty file or a template.
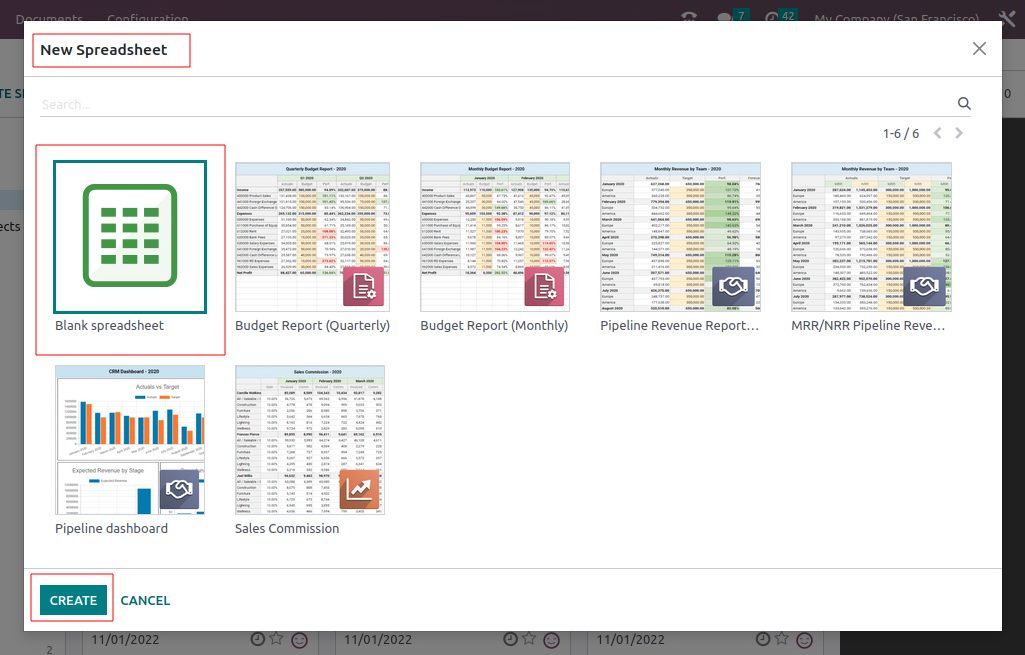
Odoo already includes default templates, and you also have the option to create new templates.
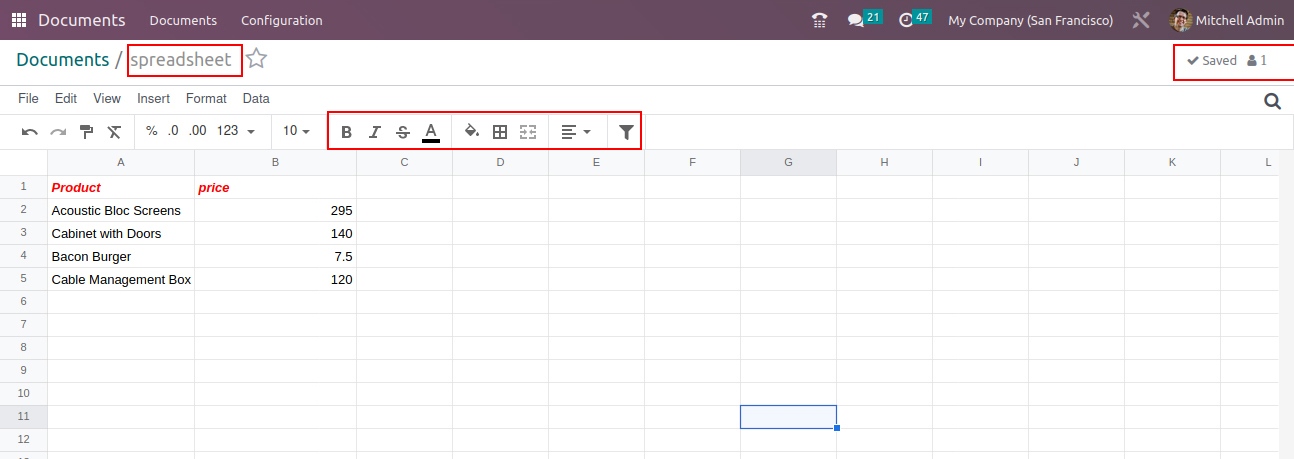
This will open a widget where you can select a template for your new spreadsheet. Select 'Blank Spreadsheet' then click the 'Create' button to create a new spreadsheet. This will open a blank Spreadsheet. Be sure to give a name to the document.
Similar to most web-based spreadsheet applications, Odoo Spreadsheet offers basic functionality, such as adding new sheets, filtering data, formatting and styling, using formulas, creating charts, and automatic saving.
The spreadsheet feature is accessible in every module and within every reporting system, and it can be initiated using the 'Insert in Spreadsheet' button.
In Odoo 16, the spreadsheet functionality is available in various modules, including Sales, Point of Sale, CRM, Accounting, Invoicing, Purchase, Inventory, Manufacturing, Projects, Timesheets, Helpdesk, Events, Website, Employees, Expenses, and Recruitment.
You can insert data into a spreadsheet from these modules, and the capability to create a spreadsheet from Odoo data is available wherever the pivot and graph view are present.
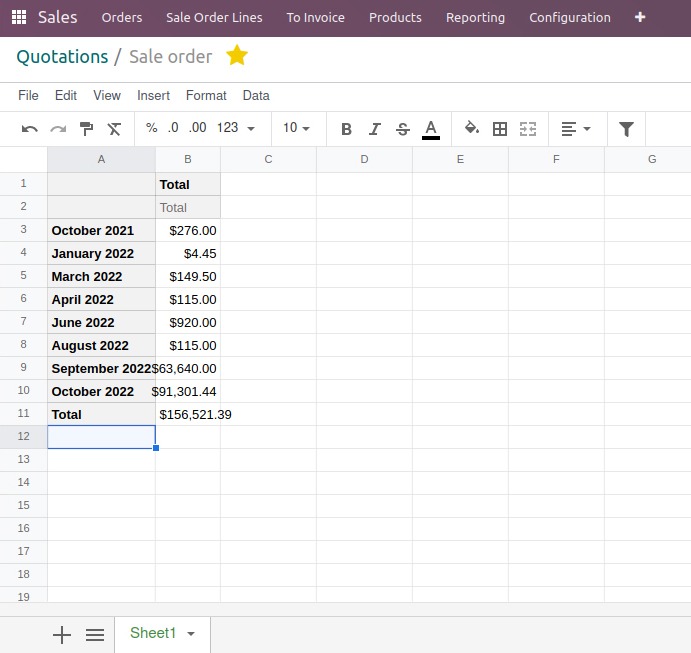
To access the spreadsheet in the Sales module, navigate to Reporting and select 'INSERT IN SPREADSHEET.'
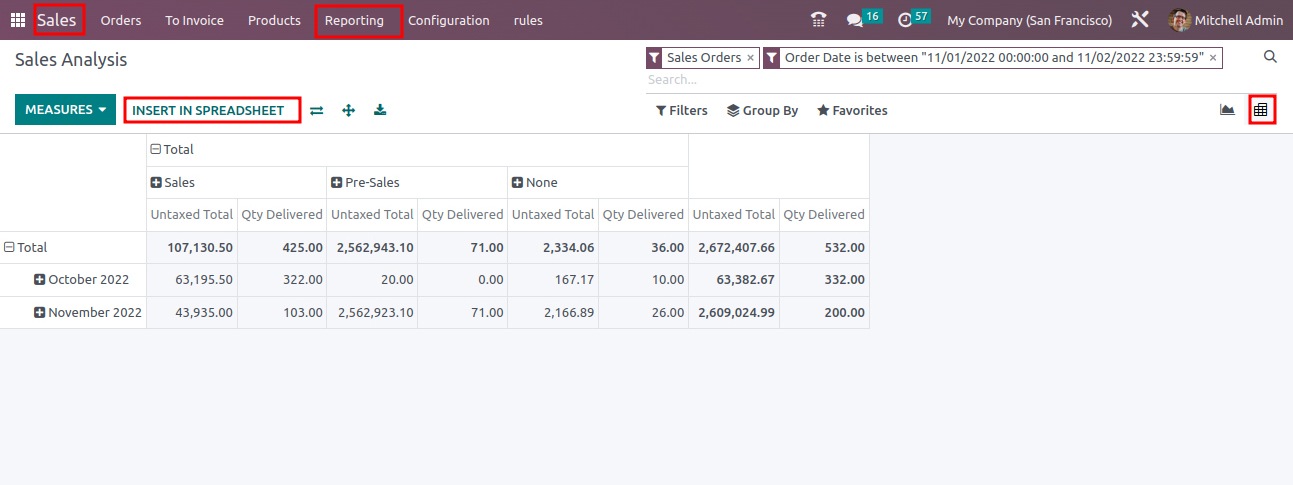
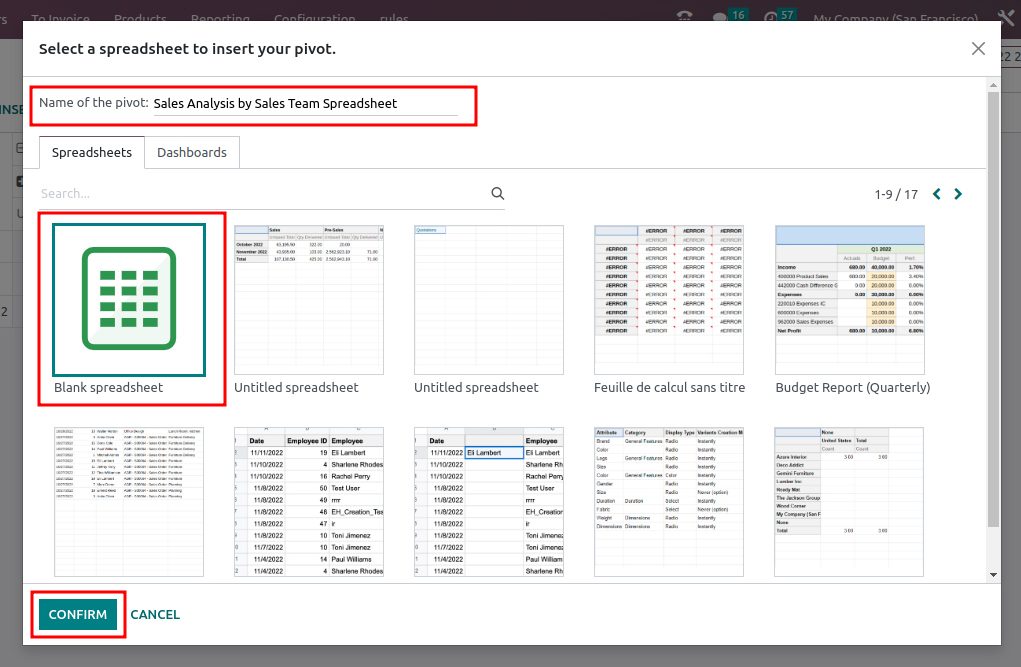
This action opens a new widget for inserting your pivot table. By selecting 'Blank Spreadsheet,' you can insert the data into a new document, whereas choosing any other entry will insert your data into an existing document. After making your selection, click to confirm, and the data will be displayed in a new spreadsheet.
Creating a New Spreadsheet in Graph View
To create a new spreadsheet in Graph View, follow these steps:
- Navigate to Reporting.
- Select 'Insert Spreadsheet.’
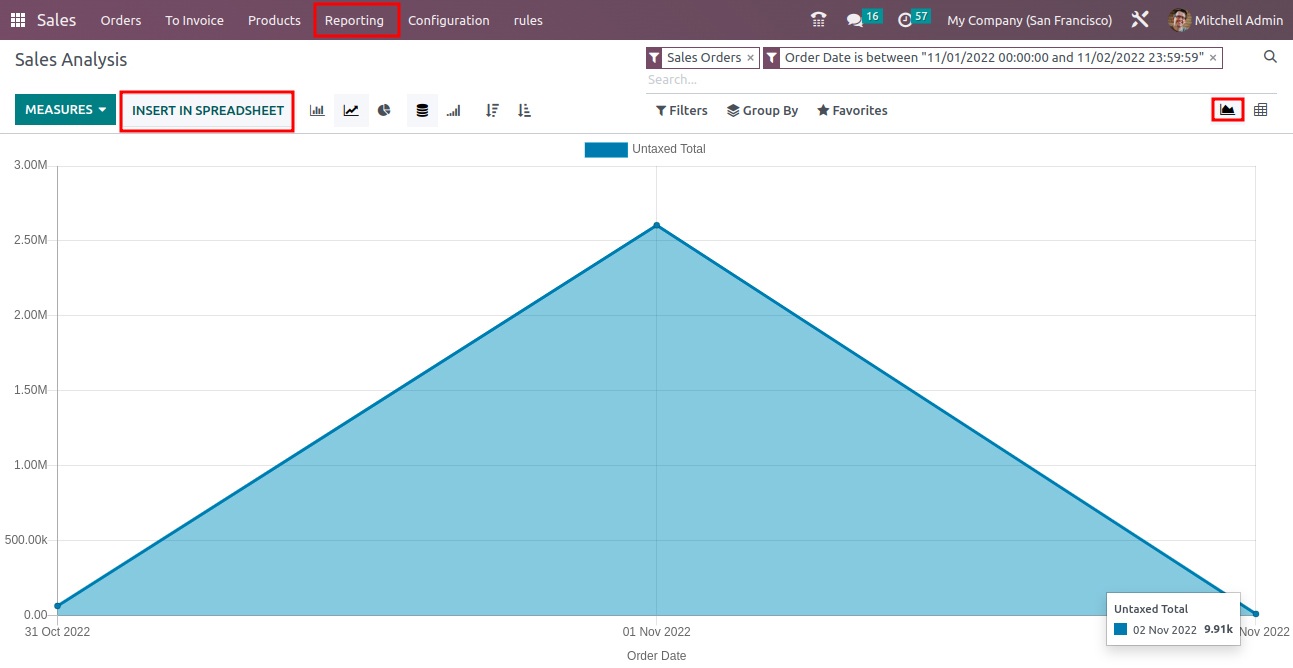
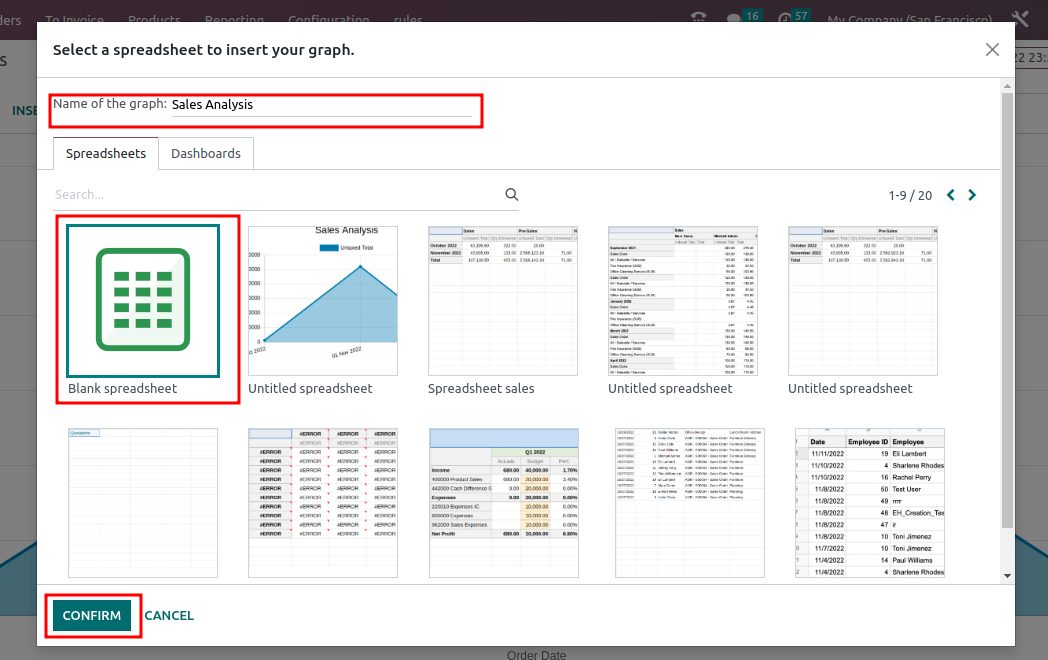
After clicking 'Insert Spreadsheet,' provide a name for the graph and choose a template. Once you have made your selections, confirm your choices.
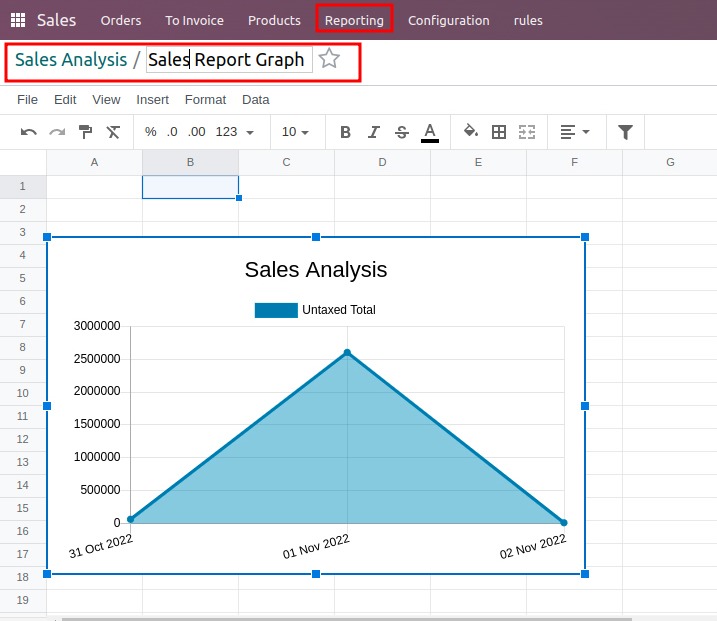
After confirmation, you will be able to see the graph created in the spreadsheet.
Freeze Panes
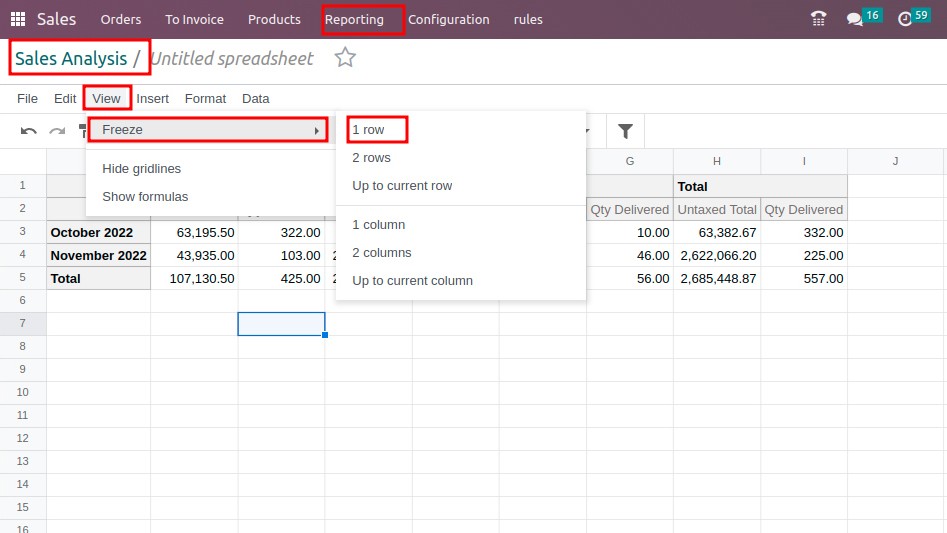
In Odoo 16, a new feature called 'Freeze Panes' has been introduced to freeze rows and columns, enhancing readability.
To use this feature, follow these steps:
- Go to 'View.'
- Select 'Freeze.'
- Choose '1 row' to freeze the top row.
Conditional Formatting
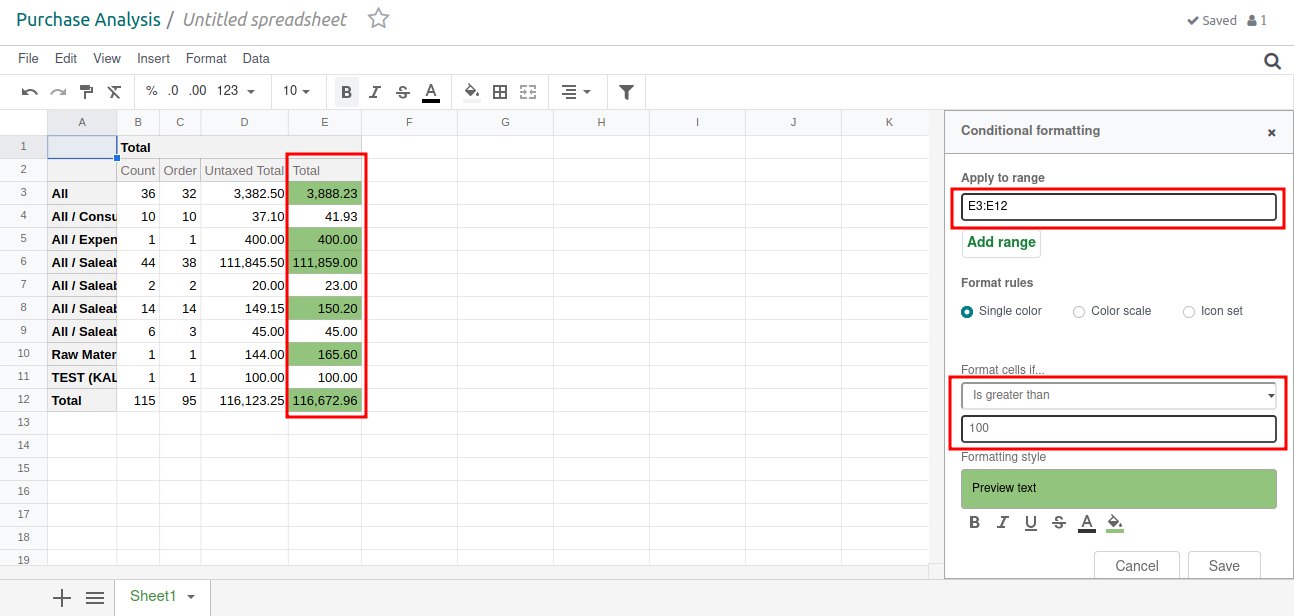
Users have the ability to highlight data based on its values through conditional formatting.
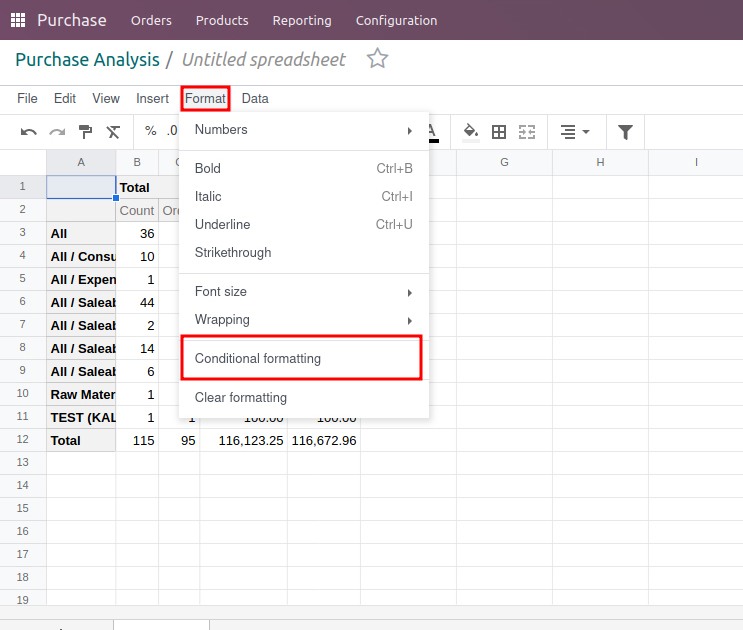
To access this feature, go to the Data menu and select 'Conditional Formatting,' which opens a new side window.
Here's how to use conditional formatting:
- First, specify the cell range you want to apply the formatting to.
- Next, select the formatting rules. You have three options for formatting: using a single color, a color scale, or an icon set. Choose the appropriate icon set from the available options.
After setting up the conditions and saving them, the formatting will be applied based on the specified rules. You can apply the same highlighting to any other field, and conditional formatting will be performed when adding new ranges.
Additionally, in Odoo, you can manage the priority of conditional formatting rules.
Charts
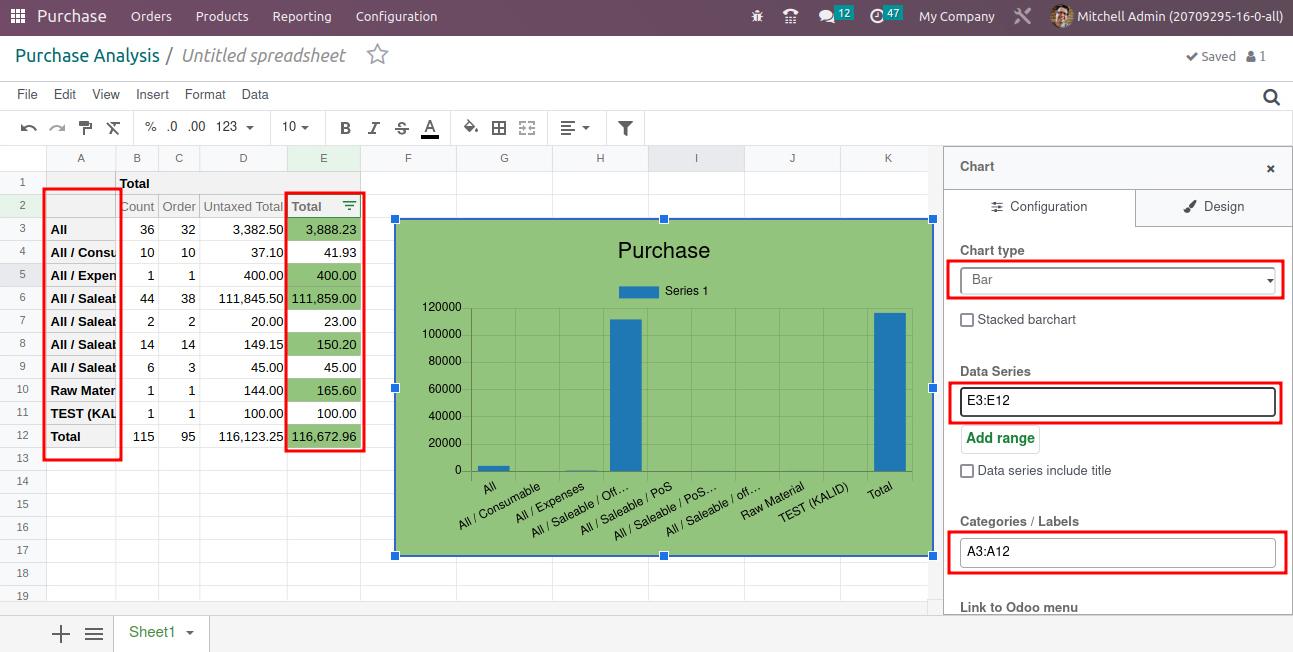
In Odoo 16, it's possible to include graph-based analysis to enhance data visualisation. You can add charts based on specified parameters, making data more comprehensible compared to a long list of numbers.
To insert a chart, click on 'Insert' and select 'Chart.'
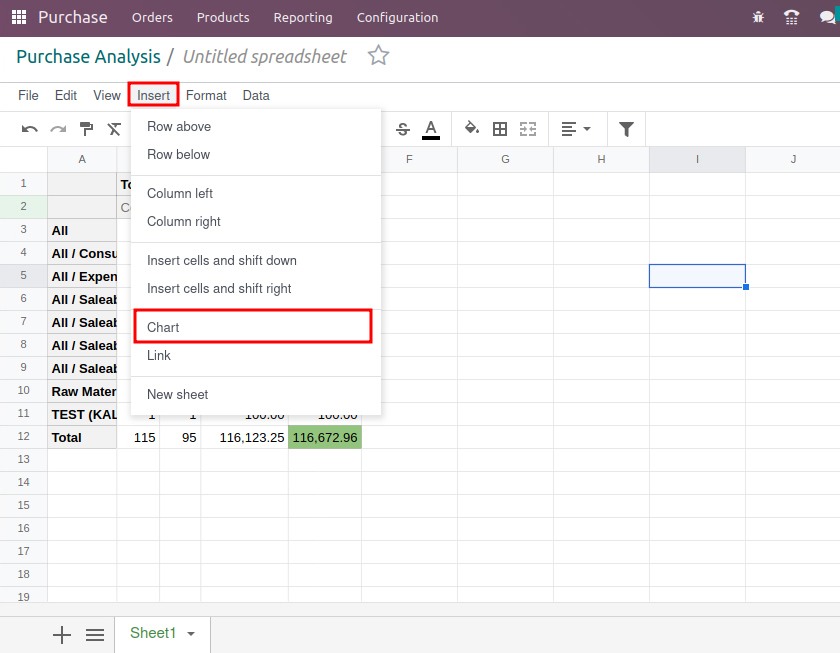
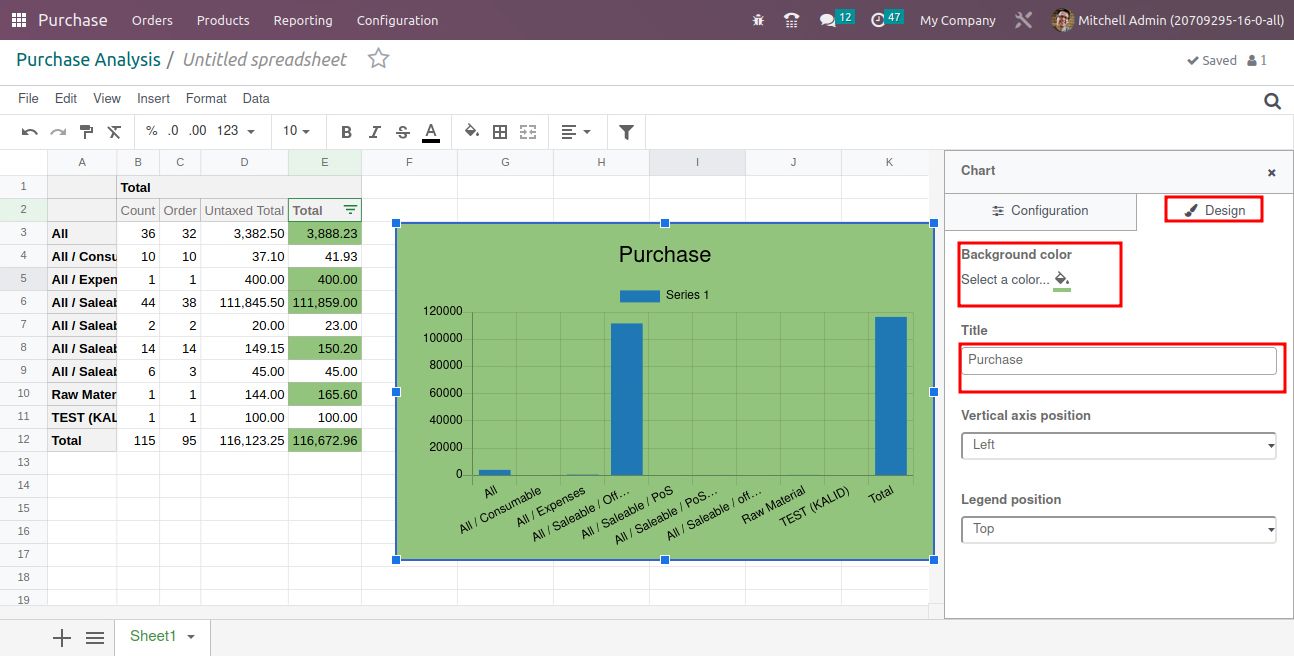
This action opens a page on the right side where you can choose from various graph types and parameters. You'll find sections for configurations and designs, and you can select from chart types such as bar charts, pie charts, and line charts.
See Records
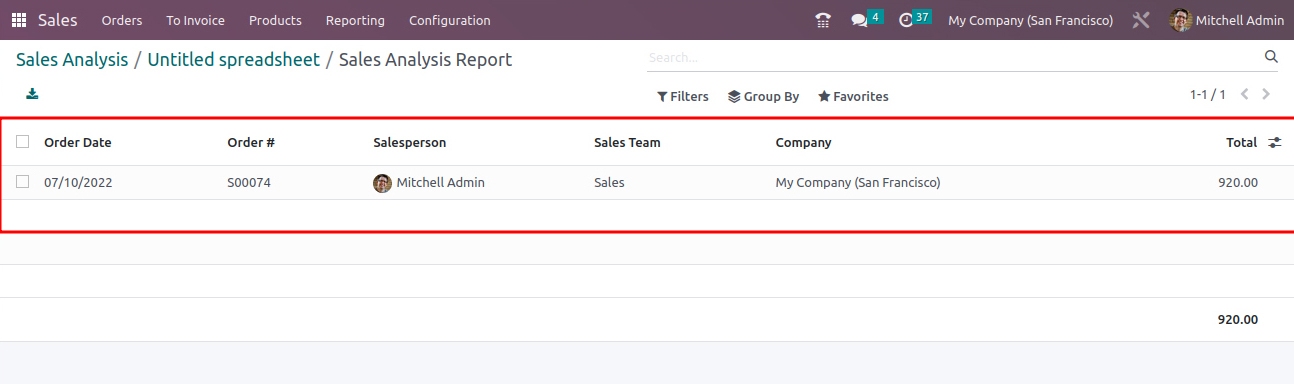
In the Odoo spreadsheet, you can easily access and view records by clicking on 'Records' and selecting the 'See Record' option.
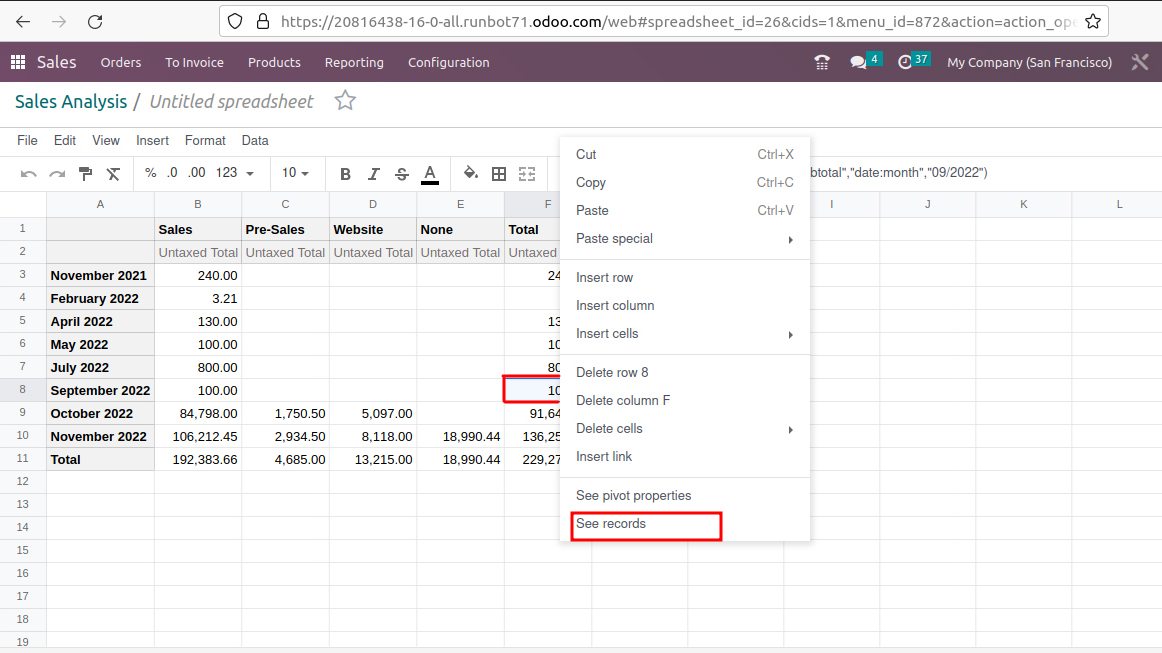
Clicking on the 'See Record' option will promptly redirect you to the respective record for quick access.
Insert list data into the spreadsheet
Easily insert list data into an Odoo spreadsheet and make an easy comparison of data.